The
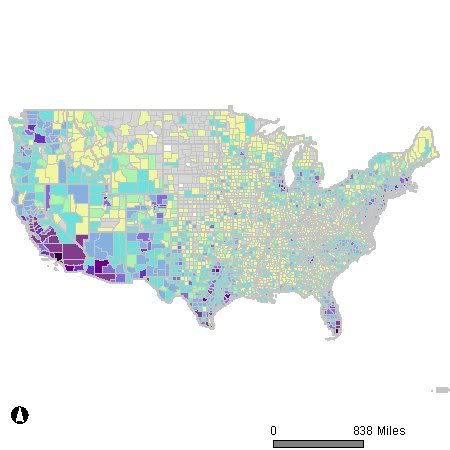
Modern Language Association has posted a new version of their interactive US language map. Given the current interest in certain political circles about exactly what languages should be allowed to be spoken in the US and an obsession with those who might speak languages other than English, this excellent interactive tool presents an opportunity to really see what all the hubbub is all about.
The map allows you to breakout any of the 33 different major languages spoken in the US by region, state or even county. With a little extrapolation one is able to find hidden ethnic enclaves or patterns of mass migration. Most importantly for our purposes, it lets us see exactly where all these non-English speakers that are causing such concern are located … or more importantly where they're not.
(There's more)tags: immigration, English only, HR4437 , Language laws, House Immigration Plan
 Before we begin our little journey into the world of linguistics, a little background information might be in order. In May, during the height of the debate over immigration reform in the Senate two dueling amendments were added to the Senate legislation dealing with English as a national language. One amendment, sponsored by and passed the Republican majority, made English the "official language" of the United States and stated that " no person has a right, entitlement, or claim to have the Government of the United States or any of its officials or representatives act, communicate, perform or provide services, or provide materials in any language other than English." A second amendment was immediately added to supercede the first. Sponsored by Democrats and passing with bipartisan support, the second amendment made English the "common and unifying language of America" and made sure that "nothing herein shall diminish or expand any existing rights under the law of the United States relative to services or materials provided by the government of the United States in any language other than English."
 Not willing to lay down the torch of language purity quite so easily, a month later House Republicans took up the fight. This time it was in the form of a threat by 79 Republican Representatives to block the renewal of the Voting Rights Act of 1965 if its requirements for bilingual voting materials were not removed from the landmark legislation. Eventually, realizing the impending public relations nightmare if the Act were to stall out, enough Republicans came on board and the Act was renewed. Yet, 33 House Republican still voted against the renewal.
What does this have to do with the linguistic map? …
A little general information is needed first.
Just under 47 million people speak a language other than English in the US according to the latest census figures. That comes out to 18% of the population.
28,101,052 10% Spanish or Spanish Creole
2,022,143 0.77% Chinese
1,643,838 0.63% French (incl. Patois, Cajun)
1,383,442 0.53% German
1,224,241 0.47% Tagalog
1,009,627 0.38% Vietnamese
1,008,370 0.38% Italian
894,063 0.34% Korean
706,242 0.27% Russian
667,414 0.25% Polish
614,582 0.23% Arabic
564,630 0.22% Portuguese or Portuguese Creole
477,997 0.18% Japanese
453,368 0.17% French Creole
418,505 0.16% African languages
365,436 0.14% Greek
317,057 0.12% Hindi
312,085 0.12% Persian
262,900 0.10% Urdu
235,988 0.09% Gujarathi
233,865 0.09% Serbo-Croatian
203,466 0.08% Other Native North American languages
202,708 0.08% Armenian
195,374 0.07% Hebrew
181,889 0.07% Mon-Khmer, Cambodian
178,945 0.07% Yiddish
178,014 0.07% Navajo
168,063 0.06% Miao, Hmong
162,252 0.06% Scandinavian languages
149,303 0.06% Laotian
120,464 0.05% Thai
117,973 0.04% Hungarian
As far as the distribution of these foreign language speakers goes, it doesn't take a demographer to figure out that different areas of the country have far different concentrations of non-English speakers. California for example has a 40% non-English speaking population, New York - 28%, New Jersey -26%, and Texas – 32%. On the other hand, West Virginia has only 3% of its population speaking a language other than English, Montana – 6%, Iowa -6%.
Lets take a look at how these percentages of non-English speakers corresponds with the states that have produced the most vocal proponents of English-only initiatives in Congress.
Sen. James Inhofe (R-OK) – sponsor of the English as national language amendment in the Senate – 8% non-English speakers (7.4% if you discount Native American Language Speakers) - a full 10% lower than national average.
Rep Steve King (R-IA) – Sponsor of the effort to block the Voting Rights Act – 6% non-English speakers. In fact the majority of those House members supporting King's effort to remove the bilingual provisions of the Voting Rights Act came from states with below average numbers of non-English speakers. Only 15 of the 55 original signatories of Kings letter to the Judiciary Chairmen about the VAR came from states with above average numbers of non-English speakers.
Rep. Peter King (R-NY) – 28%
Rep. Steve King (R-IA) – 6%
Rep. Todd Akin (R-MO) – 6%
Rep. Rodney Alexander (R-LA) – 10%
Rep. Gresham Barrett (R-S.C.) - 6%
Rep. Roscoe Bartlett (R-MD) – 13%
Rep. Marsha Blackburn (R-TN) – 32%
Rep. John Boozman (R-AR) – 5%
Rep. Jeb Bradley (R-NH) – 9%
Rep. Ginny Brown-Waite (R-FL) -16%
Rep. Henry Brown (R-SC) -6%
Rep. Dan Burton (R-IN) -7%
Rep. Steve Buyer (R-IN) – 7%
Rep. Ken Calvert (R-CA) -40%
Rep. John Campbell (R-CA) -40%
Rep. Howard Coble (R-NC) -9%
Rep. Barbara Cubin (R-WY) -7%
Rep. John Culberson (R-TX) -32%
Rep. Jo Ann Davis (R-VA) -12%
Rep. Nathan Deal (R-GA) -10%
Rep. John Doolittle (R-CA) -40%
Rep. John Duncan (R-TN) -5%
Rep. Scott Garrett (D-NJ) -26%
Rep. Virgil Goode (R-VA) -12%
Rep. Louis Gohmert (R-TX) -32%
Rep. Phil Gingrey (R-GA) -10%
Rep. Bob Goodlatte (R-VA) -12%
Rep. Sam Graves (R-MO) -6%
Rep. Gil Gutknecht (R-MN) -9%
Rep. J. D. Hayworth (R-AZ) -26%
Rep. John Hostettler (R-IN) -7%
Rep. Bob Inglis (R-SC) -6%
Rep. Ernest Istook (R-OK) -8%
Rep. William Jenkins (R-TN) -5%
Rep. Walter Jones (R-NC) -9%
Rep. John Kline (R-MN) -9%
Rep. Ray LaHood (R-IL) -20%
Rep. Steven LaTourette (R-OH) -7%
Rep. Donald Manzullo (R-IL) -20%
Rep. Gary Miller (R-CA) -40%
Rep. Jeff Miller (R-FL) -16%
Rep. Sue Myrick (R-NC) -9%
Rep. Ron Paul (R-TX) -32%
Rep. Collin Peterson (D-MN) -9%
Rep. Todd Platts (R-PA) -9%
Rep. Tom Price (R-GA) -10%
Rep. Jim Ramstad (R-MN) -9%
Rep. Dana Rohrabacher (R-CA) -40%
Rep. Ed Royce (R-CA) -40%
Rep. Jim Ryun (R-KS) -9%
Rep. Pete Sessions (R-TX) -32%
Rep. Bill Shuster (R-PA) -9%
Rep. Tom Tancredo (R-CO) -16%
Rep. Curt Weldon (R-PA) -9%
Rep. Roger Wicker (R-MS) -4%
We have know for quite some time that many of those who voice the loudest opposition to immigrants rights and comprehensive reform come from areas least effected by growing immigrant populations. The American Immigration Law Foundation did an excellent study of the voting patterns of those House members who voted for HR4437 and found that Representatives from district with few undocumented immigrants supported the bill while those with large undocumented populations opposed it.
Representatives From Districts With Fewer Than 5,000 Undocumented Immigrants Were Most Likely To Support The Bill
There are 96 congressional districts that have fewer than 5,000 undocumented immigrants. Most of these districts are largely rural and located in sections of Appalachia, the Midwest, and the Mississippi Valley that are experiencing little economic growth and low levels of immigration in general. Constituents in many of these districts face tough economic times, but the cause is not immigration. Immigrants are attracted to regions of economic dynamism and job expansion. This is why greater numbers of undocumented immigrants are found in western states that have agricultural, livestock, fishing, and tourist economies that need the kinds of less-skilled labor that undocumented immigrants often provide.
Undocumented immigrants in the 96 lowest-immigration districts make up no more than 0.8 percent of the population (each of the 435 congressional districts has roughly the same total population: about 650,000 as of 20001). The votes on H.R. 4437 in these districts tell you something about immigration politics in the United States today. The supposed threat from undocumented immigration is enough to rally voters and move levers of power even in areas where the actual impact is minuscule. Among representatives from districts with the smallest populations of undocumented immigrants, 74 percent (71 out of 96) voted for the bill: 90 percent of Republicans (56 out of 62) and 44 percent of Democrats (15 out of 34)
Representatives From Districts With More Than 50,000 Undocumented Immigrants Were Most Likely To Oppose The Bill
The voting pattern of the representatives from the 61 congressional districts with 50,000 or more undocumented immigrants tells a different story. These districts for the most part are located in densely populated urban areas such as New York City, Chicago, and Los Angeles, and are relatively small in geographic size compared to rural districts that include many counties. In these high-immigration districts, the undocumented alone can account for as much as one-fifth of the total population. As a result, representatives who hail from these areas are familiar with undocumented immigrants and their impact on local communities. Among representatives from districts with the largest populations of undocumented immigrants, a mere 5 percent (3 out of 61) supported the bill: none of the 53 Democrats and only 3 of the 8 Republicans.
The inverse relationship between support for H.R. 4437 and the actual presence of undocumented immigrants in a representative’s district represents a widespread voting pattern. Among all Democrats, those who voted in favor of the bill had roughly 10,000 undocumented immigrants in their districts. Democrats who opposed the bill, on the other hand, had about 37,400. Among all Republicans, the same pattern holds: those voting for H.R. 4437 had an average of 14,500 undocumented immigrants in their districts, while those who voted against the bill had an average of 30,800
Link
While playing around with the MLA linguistic map is neither as scientifically sound or comprehensive as the study done by AILF, it yields pretty much the same results and in fact is quite educational. I was not aware that there was an enclave of Yiddish speakers in central Washington State, or that there was a growing Filipino community in South Texas. For those with more ambition than I, it would be interesting to see the exact linguistic makeup of the various districts of House members who are most vocal about immigration. While I’m pretty sure we know the answer already it would make for an interesting study. Even in states that have high concentrations of non-English speakers, those concentrations don’t translate into across-the-boards numbers statewide. California for instance, while having a very large percent of non-English speakers still has many congressional districts that look no different than Arkansas or West Virginia. Additionally the map would be very useful in determining some the ethnic makeup of the Congressional districts in play to see exactly where immigrant voter registration drives might play an important role in upcoming elections. I’m sure I haven’t even touched the tip of iceberg as to the uses for this interactive tool, and recommend to anyone with a few extra moments to play around with it and see what you can find out … about your own area and others.
-Read Full Story-